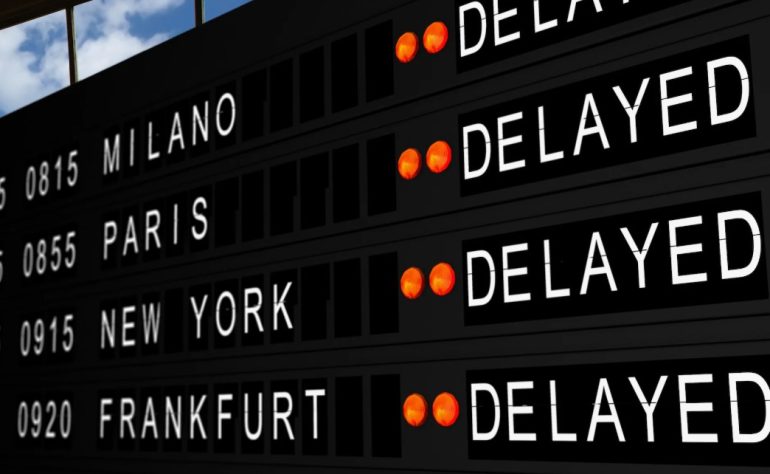
Airlines report punctuality, regulators publish it, and passengers experience something that often feels unrelated to either. The gap is not usually dishonesty. It is that “delay” is a defined term, and the definition does not match what a passenger means by the word.
The fifteen-minute rule
Across most of the industry, a flight counts as on time if it arrives within fifteen minutes of its scheduled time. Fourteen minutes late is on time. This convention exists so that statistics are comparable, and it has three consequences worth knowing.
First, the number is a pass/fail count, not an average. An airline where most late flights run twenty minutes over scores the same as one where they run three hours over. Second, it measures against the published schedule, which the airline sets. Third, it usually measures gate arrival, so a flight can land on time and still be recorded as late because no stand was free.
Four different times, all called “departure”
| Term | Means |
|---|---|
| Scheduled departure | The time on your ticket |
| Actual off-block | When the aircraft pushed back from the stand |
| Wheels-up | When it actually left the ground |
| Estimated departure | A current prediction, revised repeatedly |
Punctuality is measured on off-block. A flight that pushes back at the scheduled minute and then holds for an hour in a taxi queue is, statistically, on time. This single fact explains most of the disagreement between published figures and passenger memory. Live flight status data shows the difference directly, because it records the actual movements rather than the scheduled ones.
Schedule padding
Airlines add buffer to published block times — the same journey may be scheduled twenty minutes longer than it was a decade ago. Padding improves reported punctuality without changing anything the passenger experiences, and it is a rational response to being measured on arrival against a self-set schedule.
The tell is systematic early arrival. A route that consistently lands ten minutes early is not fast; its schedule is generous.
Where delay actually comes from
- Late inbound aircraft. The largest single cause by a distance. Delay accumulates along an aircraft’s chain of flights through the day.
- Air traffic flow management. Slots issued when airspace or an airport is constrained, often because of weather hundreds of kilometres away.
- Weather at either end. Reduced landing rates in low visibility cut throughput sharply.
- Turnaround. Cleaning, fuelling, loading, crew changes — compressed schedules leave no recovery margin.
- Crew duty limits. A hard legal ceiling; when it is reached the flight cancels regardless of everything else.
Note that only some of these are within an airline’s control, which is also why compensation rules distinguish between them.
Why big hubs look worse
Large connecting airports schedule aircraft in banks so that passengers can transfer, which concentrates movements into short windows at close to maximum capacity. That design produces efficient connections and no slack, so any disruption propagates immediately. The pattern is structural rather than a failure of management — it is visible in the operating profile of the busiest airports in the world, almost all of which run this way.
What the statistics leave out entirely
Cancellations are usually reported separately from delays, which matters because cancelling a chronically late flight improves the punctuality figure. Diversions, long tarmac holds and missed connections rarely appear at all. And nothing in the delay statistics touches the other operational metrics airlines are now measured on, including flight CO2 emissions, where longer taxi times and holding patterns have a cost that never shows up in a punctuality percentage.
Reading a figure critically
Ask four questions of any punctuality claim: what threshold, measured at departure or arrival, over what period, and including or excluding cancellations. Change any one of those and the same operation produces a noticeably different number.